


The 10-year Treasury yield climbed to roughly 5.35% last Wednesday, its highest level since 2002, and Treasury’s own auction that day cleared at 5.30%, the highest auction yield since November 2000. For context, 10-year auction yields were 4.58% just three months ago. Demand at the auction was solid (bidding was strong, and foreign buyers participating through indirect bidders took roughly 80% of the supply), which is a silver lining to the story.
Why does the 10-year matter? Because it is used as the benchmark that much of the rest of the lending world is priced against. Mortgage lenders price 30-year fixed loans at a spread above the 10-year, so when the 10-year rises, mortgage rates follow. Freddie Mac’s 30-year rate jumped to 7.28% on October 1 from 7.03% a week earlier, and the Mortgage Bankers Association’s measure reached 7.49% in the last week. And as mortgage rates have risen, the housing market has stalled. Purchase applications have fallen five weeks in a row and sit roughly 50% below the same week in 2021, while refinance applications are down about 60% from a year ago. Owners with sub-4% mortgages do not want to sell, and homes just became less affordable for potential buyers.
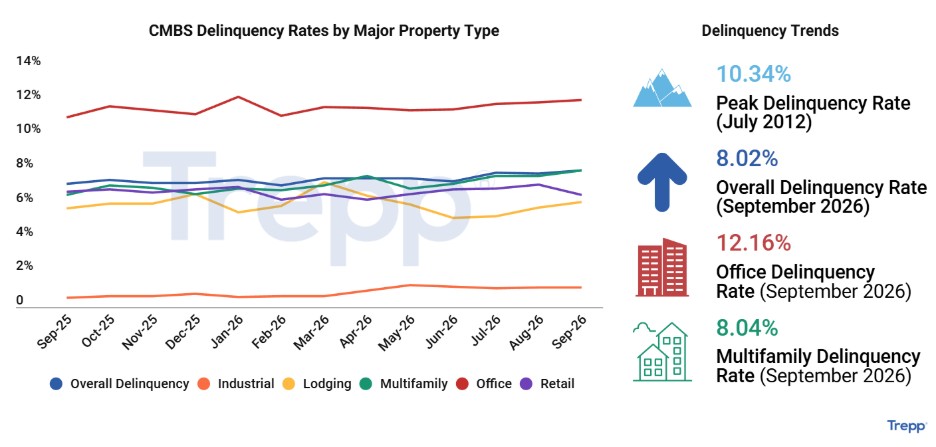
It is a similar story for commercial real estate. As interest rates have risen, so have commercial mortgage rates. And many commercial mortgages that were financed 5-10 years ago are coming due. This is causing delinquency rates across most asset classes to remain elevated:
Source: Trepp Research
Despite the high delinquency rates, we do not believe that this is a systemic event on its own because the CMBS market is a relatively small slice of the overall credit market and these problems have been visible for a while. However, the recent rise in rates put additional pressure on these borrowers and as long as the 10-year stays elevated, “extend and pretend” gets harder, because banks stop pretending.
“Should I Sell Before the Midterms?”
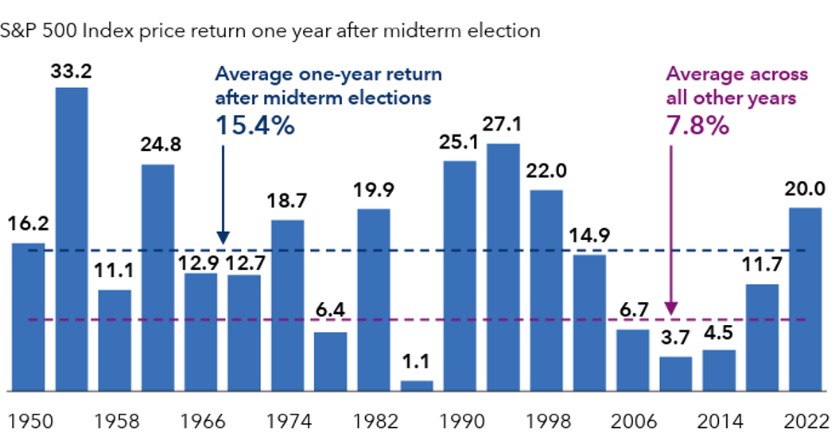
With the midterm elections just three weeks away, we’ve been hearing something similar to the following from a number of people. “I am worried about the markets and what is going on around the world. And on top of that, we have the midterm elections around the corner. Should I get out of the market until I can be more confident in what is going on?” These thoughts are completely understandable. Between the war in the Middle East, rising yields, and a noisy political environment, the temptation to sit on the sidelines until things feel clearer is rational. With that said, our view is that history argues against it, and the chart below is the reason.
Source: Capital Group, Midyear 2026 Outlook
Per Capital Group, the S&P 500’s price return the year following every midterm election since 1950 has been positive. The average one-year return after a midterm was 15.4%, roughly double the 7.8% average across all other years. Additionally, in all 19 instances, the market was higher a year later, and the weakest of them was still a gain of 1.1%. 14 of the 19 were double-digit gains. Why is this? We believe that this can be largely attributed to uncertainty. Markets tend to be choppy heading into a midterm because the outcome is unknown, and once the results are in and the political landscape is clear, helping make people and businesses more likely to invest. While history doesn’t repeat itself, it does tend to rhyme.
Consumer Sentiment: Near Record Lows, and the Reasons Surround Us
The University of Michigan’s preliminary October reading showed consumer sentiment falling to 46.3 from 48.1 in September, a five-month low and just a point and a half above the record-low territory it touched in May. The more eye-catching number is the “current conditions” index, which measures how consumers feel about their situation right now. It fell more than 12% to 44.7, a low versus 50.9 a month earlier. About 46% of respondents cited higher prices as hurting their buying conditions for big-ticket items like cars and appliances, the most since August 2022, and views on buying conditions for durable goods hit a record low.
The “why” is a combination of things hitting households at once. Energy is the biggest one as gas prices have been above $4 since mid-summer and are up more than $1.50 a gallon since the Iran conflict began. Borrowing costs are another, with mortgage rates in the 7s and the 10-year at 24-year highs, financing a home or a car has become much more expensive. Lastly, inflation expectations are moving the wrong way, with year-ahead expectations at 4.7% compared with 3.4% in February, before the war began.
It’s worth noting who is feeling this most. Sentiment dropped steeply among lower-income consumers and among those with smaller stock portfolios, the households with the least cushion to absorb higher prices. This fits into a pattern we’ve talked about before: a K-shaped consumer, where households with significant assets are doing fine and everyone else is stretched. It also shows why sentiment and markets can diverge. Stocks are priced off corporate earnings, and sentiment surveys tend to be a poor short-term predictor of market returns.
Hope you have a great week, and remember, volatility is the price of admission.
Best,
Park City Investment Solutions Team
This material is for informational purposes only and does not constitute investment advice or a recommendation to buy or sell any security. Opinions expressed are as of the date of publication and are subject to change. Past performance is not indicative of future results.
