

FactSet’s latest Earnings Insight report, published this past week, shows that with roughly twenty seven percent of S&P 500 companies having reported second quarter results, the blended earnings growth rate has jumped to 37.9%, up sharply from 24.8% just a week earlier and now on pace for the strongest year over year growth the index has posted since the third quarter of 2021. At first glance, this is an impressive number but we think it is important to provide context around this number as the data has been heavily impacted by Alphabet’s recent earnings.
Last week, Alphabet reported earnings per share of $9.11 against an estimate of just $2.88, an unusually large beat that by itself accounted for the vast majority of the net dollar increase in S&P 500 earnings over the past week. That figure includes a $98 billion GAAP gain tied primarily to unrealized gains on equity securities the company holds, meaning it reflects a paper markup on an investment stake (SpaceX) rather than operating profit from selling ads or cloud services. Strip Alphabet out of the calculation entirely and the blended growth rate for the index falls to 25.9%, which is still an excellent number historically, but a meaningfully more honest description of how corporate America is actually performing this quarter.
Seven of eleven sectors are still reporting double digit earnings growth, led by Energy, Communication Services, and Information Technology, and revenue growth for the index is running at 13.2%, the fastest pace since 2022. On average, the underlying picture remains genuinely strong, which helps explains how well the markets have held up this year despite all the noise around the world.
Unemployment Data: The Other Side of the Coin
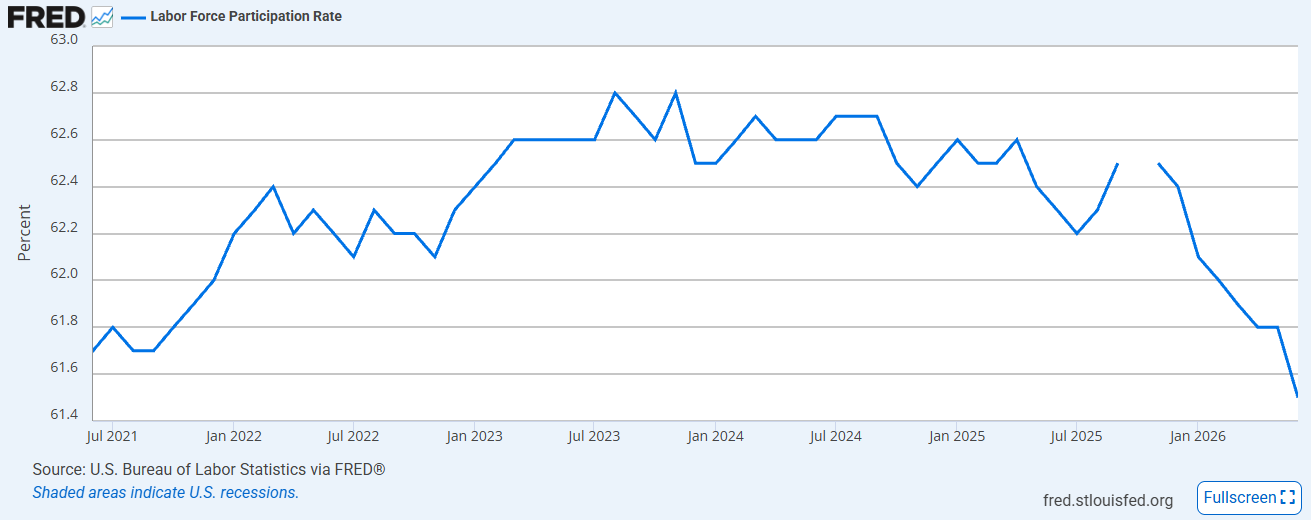
While on average the employment data that we are seeing remains healthy, there is a rain cloud or two in the largely sunny sky. For example, the recent drop in the unemployment rate has had less to do with more people finding jobs and more to do with fewer people looking for one. The labor force participation rate recently fell three tenths of a percentage point to 61.5%, its lowest level since early 2021 (See below chart), and the employment to population ratio slipped as well. When people stop actively searching for work, they are no longer counted among the unemployed, which mechanically pushes the unemployment rate lower.
 Corporate Credit Spreads Are Sitting Near Their Tightest Levels in a Decade
While most of the market’s attention has been focused on stock prices and Fed policy, one of the more interesting signals sitting quietly beneath the surface is how little extra yield investors are demanding to own corporate bonds instead of Treasuries. Investment grade spreads and high yield spreads have both compressed to levels rarely seen outside of the late 1990s, with high yield spreads recently dipping below three hundred basis points, a level that history shows has occurred only a small fraction of the time over the last decade. See below data from Guggenheim as of 6/30/2026:
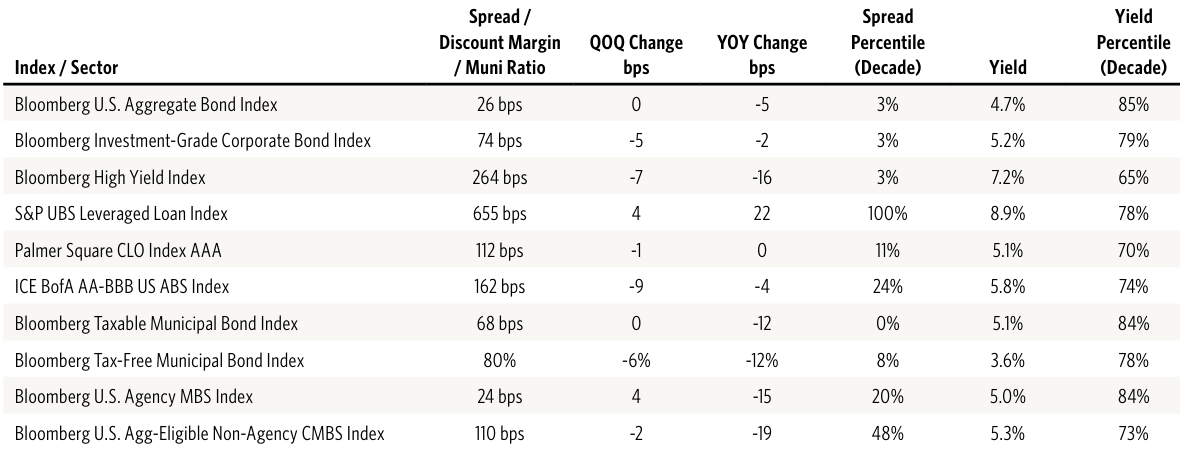 Looking at the Spread Percentile over the last decade, we can see that rarely have we seen spreads this tight. However, looking at the Yield Percentile, the overall yield being paid has rarely been this high, which is the silver lining to the spread compression story.
Hope you have a great week, and remember, volatility is the price of admission.
Best,
